


How many articles have you read that suggest you not look at your 401(k) during this market downturn? That might be sound advice if you have many years left to retire, but, if you’re close to retirement or already retired, isn't a market downturn exactly the time to look at your 401(k)? After all, you've stashed away hard-earned money to empower your golden years. Why let that slip away?
The stock market has an uncanny ability to surprise you, sometimes more than you want it to. Case in point—the recent headline-driven stock market price action. While it's true that, over the longer term, the broader market tends to trend higher, if you're not in a position to patiently wait for the market to return to its bullish trend, you may want to reevaluate your portfolio sooner rather than later. The "set-it-and-forget-it" strategy can work at times, but not always.
Let's look at where the overall stock market stands by analyzing the one-year daily chart of the S&P 500 ($SPX). The S&P 500 is trading well below its 200-day simple moving average (SMA) and trending lower.
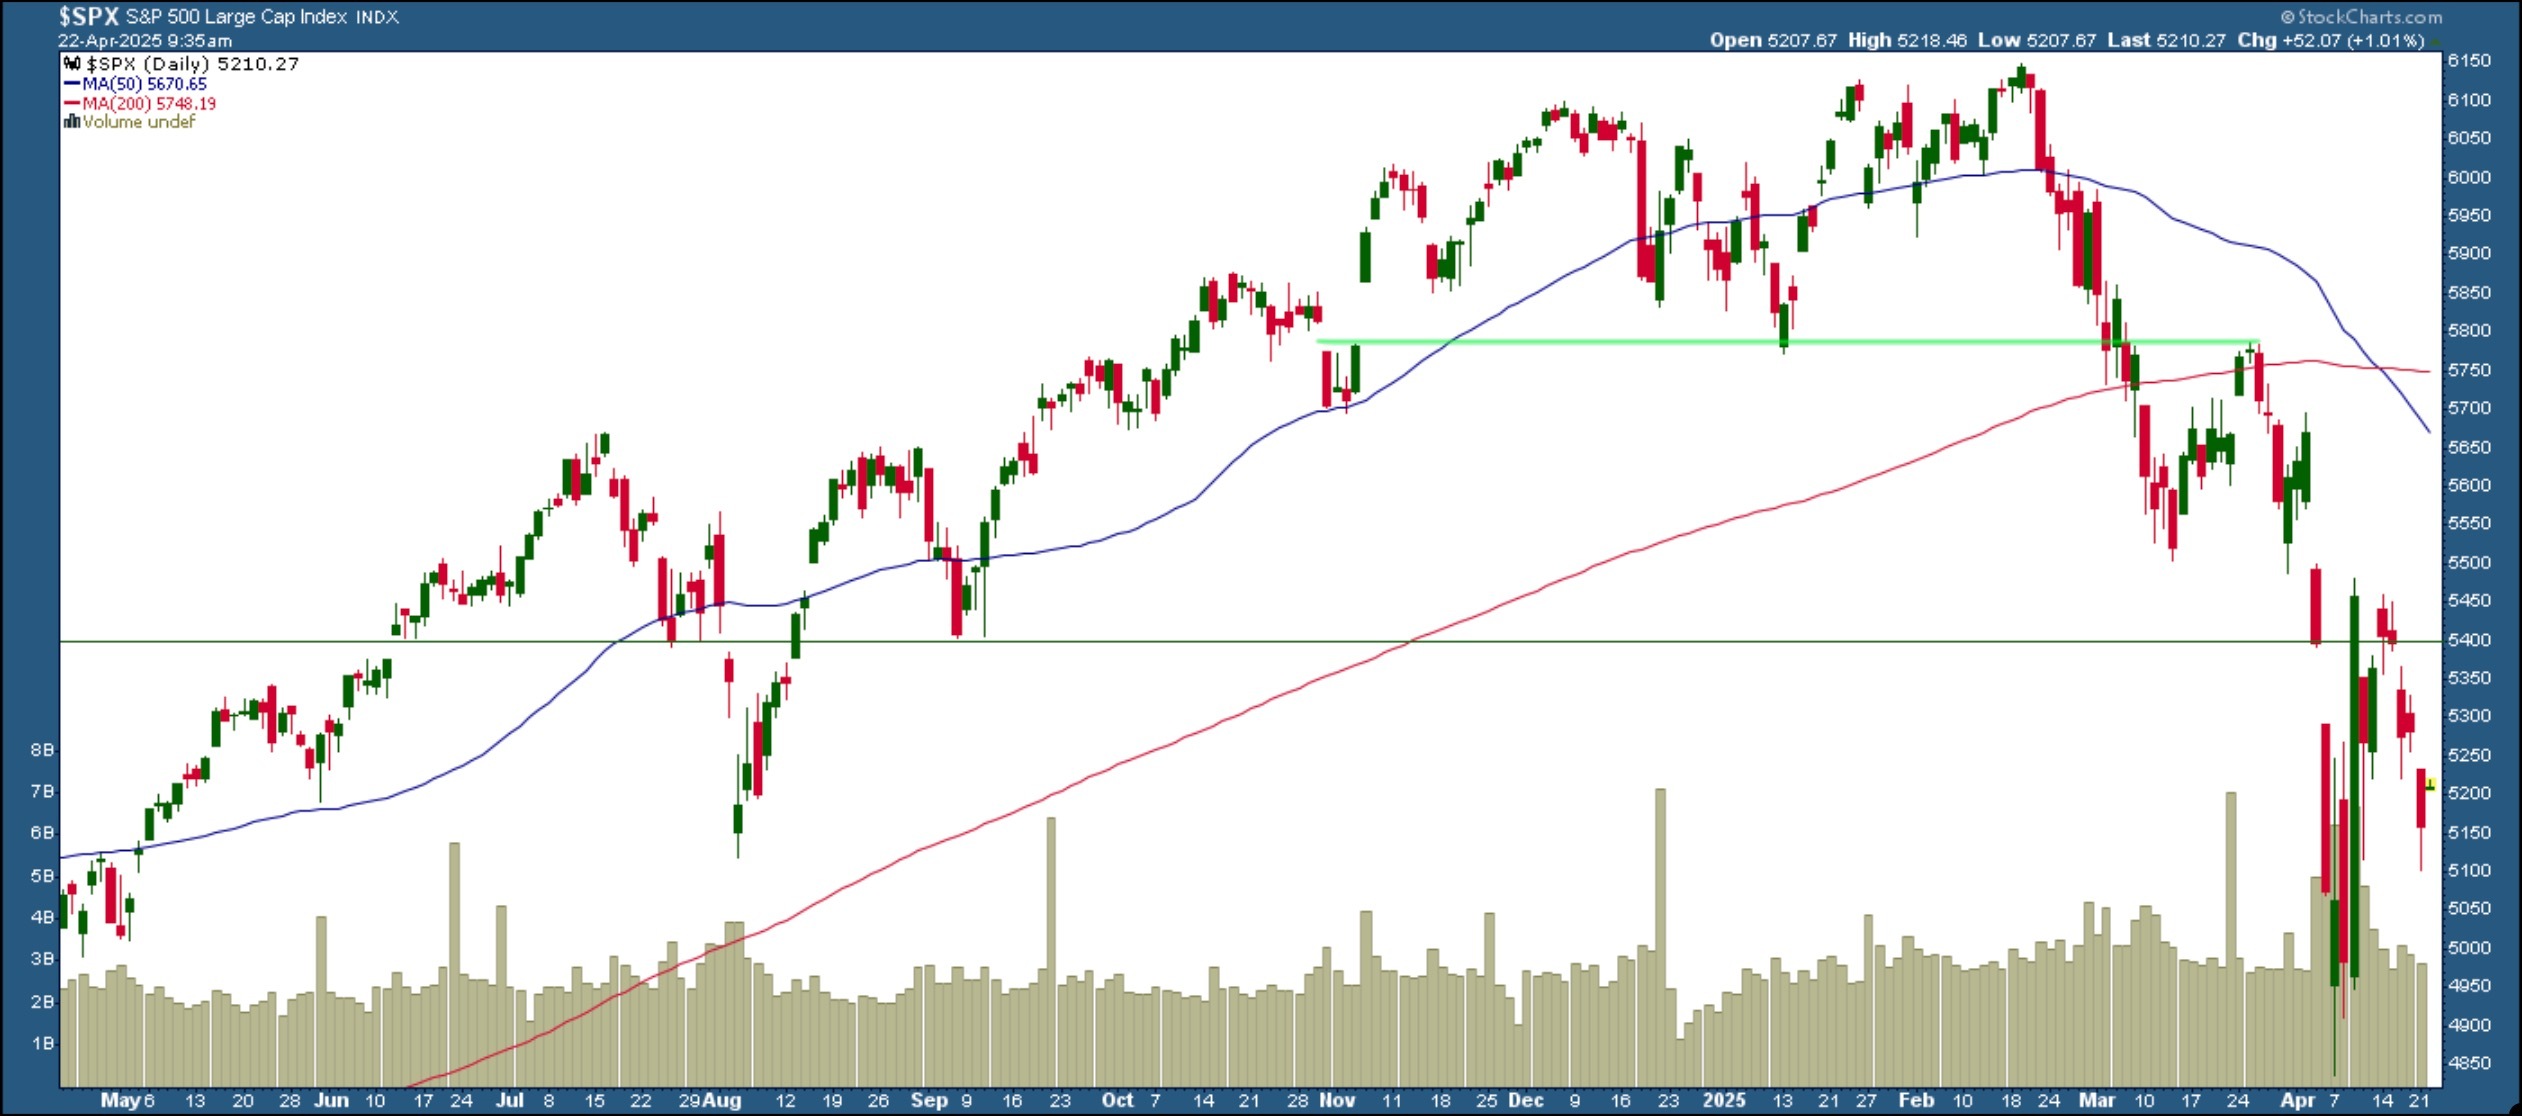
FIGURE 1. DAILY CHART OF S&P 500. After falling below its 200-day moving average, the S&P 500 is struggling to remain above its 5400 level. Will it hold?Chart source: StockCharts.com. For educational purposes
In addition to trending lower, the 50-day simple moving average (SMA) has crossed below the 200-day SMA, further confirming the downward trend in the index.
After reaching a high of 6147.43 on February 19, 2025, $SPX started its decline, falling below its 50-day SMA and then its 200-day SMA. Although the index tried to bounce back to its 200-day SMA, it failed to break above it and fell to a low of 4835.04 on April 7, 2025. Since then, the S&P 500 has been trying to bounce back. It filled the April 4 price gap, but has stalled around the 5400 level since then, on lower volume. This could be because investors are sitting on the sidelines waiting for the next tariff-related news, which could send the S&P 500 higher or lower.
Going further back on the chart, the 5400 was a support level for the September 2024 lows, between the end of July and early August, and again in mid-June. There have also been price gaps at this level during those times. The chart of the S&P 500 has a horizontal line overlay at the 5400 level. This could act as a resistance level for a while, or the index could soar above it, in which case this level could act as a support level.
There are several indexes you can analyze besides the S&P 500. For example, if you have a tech-heavy portfolio, you will want to use the Nasdaq 100 Index ($NDX). If your portfolio is concentrated in small-cap stocks, you could use the S&P 600 Small Cap Index ($SML). Explore the massive collection of indexes on StockCharts.com by typing "indexes" in the search box.
It's worth monitoring the Bullish Percent Index (BPI) of the S&P 500. The daily chart below displays the S&P 500 BPI ($BPSPX) in the top panel and $SPX in the bottom panel.
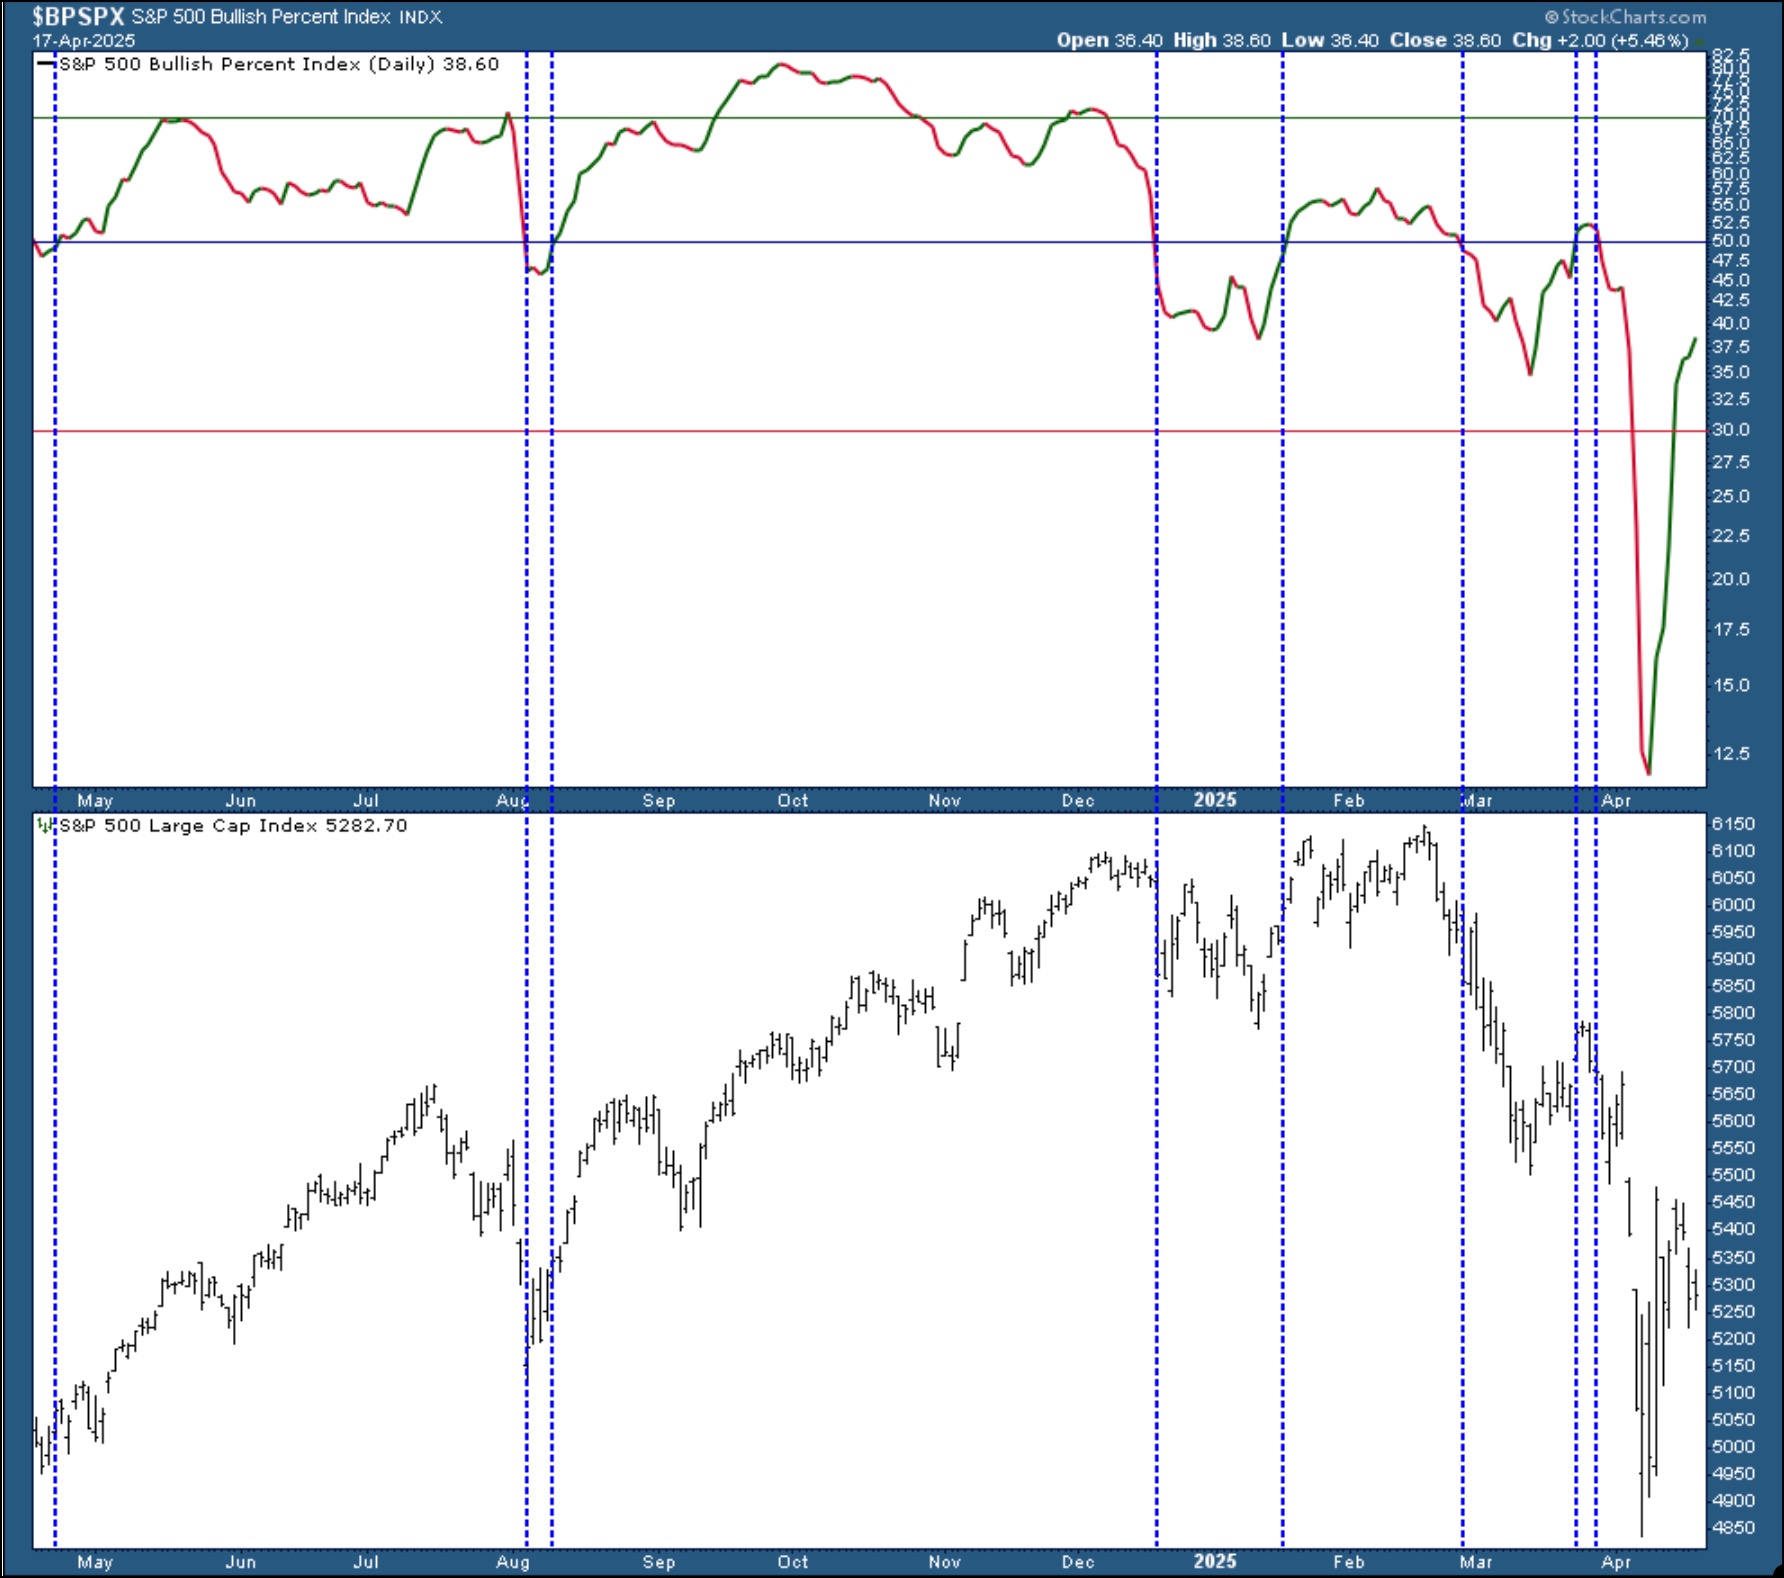
FIGURE 2. BULLISH PERCENT INDEX FOR THE S&P 500. The $BPSPX recovered after falling below 12.5. Even a move over 50 should be eyed with caution. Chart source: StockCharts.com. For educational purposes.
The recent slide in the S&P 500 took the $BPSPX to well below 12.5, which, as you can see from the chart, is a significantly low level. While it’s encouraging to see $BPSPX reverse and cross above 30, it’s still not bullish. A rise above 50 would be a bullish signal. As you can see in the chart, however, the last time $BPSPX crossed above 50 (dashed blue vertical lines), it turned back lower, only to start its descent to the lowest level in the past year.
Learn more about the Bullish Percent Index and use it to determine if bulls or bears are dominant.
Save your excitement until the $BPSPX is over 50 and there’s a turnaround in the $SPX. This could take a while, so, if you're close to retirement or already retired, you may have to consider selling the rip, or if the situation turns bullish, buying the dip. The best you can do is evaluate your portfolio and make decisions that are aligned with your lofty retirement plans.
So, go on! Look at your 401(k) now!
Disclaimer: This blog is for educational purposes only and should not be construed as financial advice. The ideas and strategies should never be used without first assessing your own personal and financial situation, or without consulting a financial professional.
About the author:

Feeling confident about your investment decisions can be difficult. We get it. At StockCharts, we're investors too. StockCharts was founded 25 years ago to help investors cut through the noise of the markets using the best market data, technical charts, and trading analysis tools in the world.
Our award-winning flagship product, SharpCharts, is the gold standard for online technical analysis. SharpCharts provides you with an intuitive and comprehensive set of tools to analyze market trends and make informed trading decisions.
Create large, advanced charts
Real-time Intraday Data
Technical Indicators and Overlays
Auto-refresh
Candlesticks, lines, bars, and much more

Here’s what a few have to say about us:
"I have learned a lot over the past 5 years and have carved out a style of trading that is within my risk threshold and provides me a way to find excellent setups with terrific risk-reward. I owe StockCharts a debt of gratitude for building such a robust system... Thanks again!"
The more I read and study from trading pros, the more I appreciate all of the wonderful tools available on your website. I’m becoming a smarter and “better-educated trader” as I continue learning from your seasoned experts, videos, and trading tools. Trading is no longer a hobby. It’s now a part-time home-based business for me. Thank you all for what you do.
Our Charts Have Been Seen On


